How to animate a curve?

I want to Animate the curve as well
file

I have this code for the bars:

<Rectangle ux:Class="MyRectangle" Width="50" Color="Blue" CornerRadius="3,3,0,0" StrokeWidth="0" StrokeColor="#2af">
  <LayoutAnimation>
    <Resize RelativeTo="SizeChange" Duration="1" Vector="1" />
    <Move RelativeTo="PositionChange" Duration="1" Vector="1" />
  </LayoutAnimation>
  <LinearGradient>
    <GradientStop Offset="0" Color="#cf0" />
    <GradientStop Offset="1" Color="#f40" />
  </LinearGradient>
</Rectangle>

And this for the curve:

<Curve StrokeWidth="2" StrokeColor="#256fe8" Tension="0.3" Extrude="Bottom" Fill="#c48"  Opacity="0.35">
   <Each Items="{bars}">
      <CurvePoint X="{pos * 2 +0.1}" Y="{(1 - level)}" />
   </Each>
</Curve>

How do I animate it?

Hi Itai,

would you mind posting complete repros? Something that one could copy&paste and run?

Otherwise guessing what the JS part of your code looks like is near impossible, and reconstructing it takes far too much time.

A single-UX-file app usually is what works best, with the JS bits in-lined.

<App>
    <JavaScript>
	var Observable = require('FuseJS/Observable');

	var bars = [
		{pos: Observable(0.0), level: Observable(0.1), bar: Observable(10)},
		{pos: Observable(0.1), level: Observable(0.1), bar: Observable(20)},
		{pos: Observable(0.2), level: Observable(0.1), bar: Observable(30)},
		{pos: Observable(0.3), level: Observable(0.1), bar: Observable(40)},
		{pos: Observable(0.4), level: Observable(0.1), bar: Observable(30)}
	];

	function getRandom() {
		var min = 0;
		var max = 100;
		var myRND =  Math.floor(Math.random() * (max - min + 1)) + min;
		return myRND;
	}

	setInterval(function() {
		bars.forEach(function(b,index) {
			//debug_log("index = " + index );
			b.bar.value = getRandom();
			b.level.value = b.bar.value/100;

			});
		
		}, 1000);

	module.exports = {
		bars: bars,

	}

    </JavaScript>

	<Rectangle ux:Class="MyRectangle" Width="50" Color="Blue" CornerRadius="3,3,0,0" StrokeWidth="0" StrokeColor="#2af">
	  <LayoutAnimation>
		<Resize RelativeTo="SizeChange" Duration=".5" Vector="1" />
		<Move RelativeTo="PositionChange" Duration=".5" Vector="1" />
	  </LayoutAnimation>
	  <LinearGradient>
		<GradientStop Offset="0" Color="#cf0" />
		<GradientStop Offset="1" Color="#f40" />
	  </LinearGradient>
	</Rectangle>

		<StackPanel ItemSpacing="40" ContentAlignment="Center" >

			<Panel Alignment="Center" Width="100%" Height="160">
				<DockPanel Alignment="Center" >
				  <Each Items="{bars}">
					  <StackPanel Dock="Left" ItemSpacing="20" Orientation="Vertical" ContentAlignment="Center"  >
						<Text Value="{bar}" Width="40" Margin="2"  Background="#c9e8b4"/>
						<Text Value="{level}" Width="40" Margin="2"  Background="#c9e8b4"/>
						<Text Value="{pos}" Width="40" Margin="2"  Background="#c9e8b4"/>
					  </StackPanel>
				  </Each>
				</DockPanel>
			</Panel>

		<Panel Color="#c9e8b4" Height="200" Alignment="Center" Padding="0">

			<DockPanel  >
			  <Curve ux:Name = "myCurve" StrokeWidth="2" StrokeColor="#256fe8" Tension="0.3" Extrude="Bottom" Fill="#c48"  Opacity="0.35">

				<Each Items="{bars}">
				  <CurvePoint ux:Name="myPoint" X="{pos * 2 +0.1}" Y="{(1 - level)}" />
				  <LayoutAnimation>
					
				  </LayoutAnimation>
				</Each>

			  </Curve>
			</DockPanel>

			<StackPanel Orientation="Horizontal" ItemSpacing="2" Alignment="HorizontalCenter">
				<Each Items="{bars}">
				  <DockPanel>
					<!--Text Value="{bar}" Dock="Top"/-->
					<MyRectangle Height="{bar*2}" Alignment="Bottom"  />
				  </DockPanel>
				</Each>
			</StackPanel>
		</Panel>

	  </StackPanel>
</App>

Animating a curve is probably a tiny bit more complicated than just sticking a LayoutAnimation on it. You should check out the Charting example we have and go from there.

All Charting examples are based on the Pro plan, which I don’t use for now.
I want to simply animate a curve (if possible).

Pro plan or not, if you want to animate a Curve you need to use Attract. And the example I linked shows how to do that.

Clarification!

My bad and miscommunication; Attract is currently part of the Pro plan, too. This might get added to fuselibs-public at some point, but it’s not there yet and there is no ETA if, when or whether at all that will happen.

Hence the confusion and my apologies for that.

To keep you moving, there is a potential solution using the open Attractor. This is going to be somewhat more complex, but totally doable.

…No example, so I have no clue how to use this

Plenty of examples, here’s a couple links:

I think non of these can works on <CurvePoint> because I access every point.
With other odjects, as Rectangle / Panel / other, I can alter and animate Size / Position / Color , but with <CurvePoint> there is no Tag under <LayoutAnimation> to animate X and Y of every point.
I can only gess that it is because they are sub-object of <Curve> . when you change Height of a rectangle, there is only one properties, in Curvpoints it is more like an array of properties.
as for the Attractors, it seems it relays on the same options, so it doesn’t add a way to animate the curve point.
In short, unless the Fuse team has undocumented tricks, no animation to <CurvePoint>.

When using an Attractor, you do not need a LayoutAnimation.

Each CurvePoint needs its own Attractor.

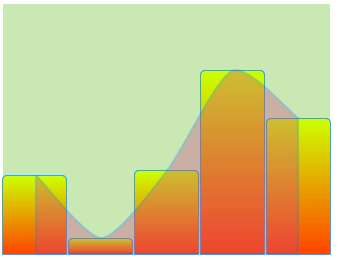
As you change the Value of an Attractor, which targets the At property (or Y if you like) of a CurvePoint, the Curve will animate, depending on how a particular CurvePoint position was affected.

will it works if I generate the curvepoints dinamicaly with <Each>?
how do I attach an Attractor for each point then?

This example animates the Y coordinate of the Curve.

<App>
	<JavaScript>
		var Observable = require( "FuseJS/Observable" )
		
		var max = 3
		var items = Observable()
		exports.items = items

		// each item in the list is an observable since we need to animate the same object
		// a future extension to `Each` will avoid this need
		for (var i=0; i <= max; ++i) {
			items.add( Observable( { x: i/max, y: Math.random() } ) )
		}
		
		exports.next = function() {
			for (var i=0; i <= max; ++i) {
				items.getAt(i).value = { x : i/max, y: Math.random() }
			}
		}
	</JavaScript>
	<Curve StrokeWidth="5" StrokeColor="#000" HitTestMode="LocalBounds" Clicked="{next}">
		<Each Items="{items}">
			<!-- The NodeGroup is needed since we need a name for the CurvePoint for Attractor
				to refer to. Directly inside an `Each` we have templates though, which cannot refer to
				each other. -->
			<NodeGroup>
				<Attractor Target="cp.Y" Value="{y}" Type="Elastic" Unit="Normalized"/>
				<CurvePoint X="{x}" ux:Name="cp"/>
			</NodeGroup>
		</Each>
	</Curve>
</App>

Once attract is available in fuselibs (coming soon), you can replace the Curve part with this simpler code:

<AttractorConfig ux:Global="lineAnim" Type="Elastic" Unit="Normalized"/>
<Curve StrokeWidth="5" StrokeColor="#000" HitTestMode="LocalBounds" Clicked="{next}">
	<Each Items="{items}">
		<CurvePoint X="{x}" Y="attract({y},lineAnim)"/>
	</Each>
</Curve>

Thank’s